Various statistics for your log are computed in the Log Stats section of MyQSX Log. The stats are found using any selected contacts. If no contacts are selected, the entire logbook is used.
The statistics and graphs include:
•Total QSO's analyzed
•First contact details
•Last contact details
•Unique callsigns (count excludes callsign dupes)
•Average time between contacts
•QSO Mode pie chart
•Digital Modes pie chart
•Bands pie chart
•DXCC QSL status pie chart
•QSO Activity by year area chart
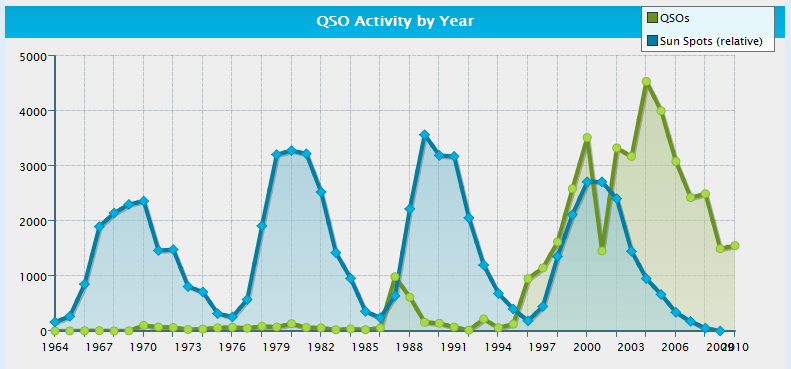
The QSO Activity graph includes a relative sun spot number plot so you can see how your activity varied with sun spots. Keep in mind that the numbers shown for sun spots are relative and do not reflect the actual numbers.
Move the mouse pointer over the various sections of each graph to see details.
Click the Home button to return to the MyQSX Logbook main menu.
Logbooks containing a large number of contacts can take several minutes to analyze. Please be patient. The stats functions have been tested using a log with over 80,000 contacts.